
The field of economics is a set of stories that we tell to better understand the economy. I thought of this when reading a new post by Matthew Klein:
If I had to pick one chart to tell the story of the U.S. economy since the end of WWII, it would be this:
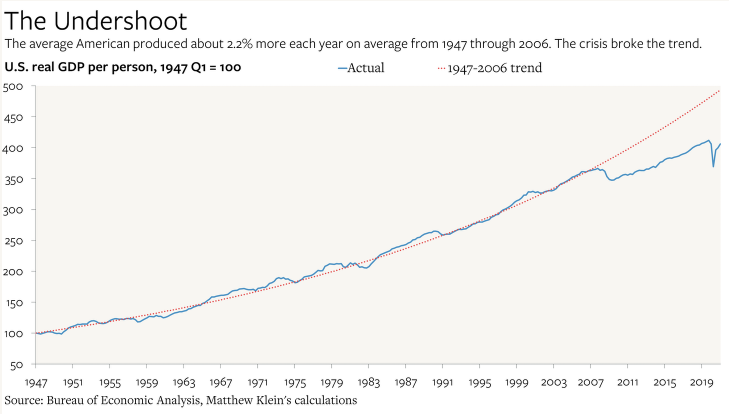
Indeed Klein views the post-2006 slowdown in RGDP per capita as being so important that his Substack is entitled ‘The Overshoot”, an indication that we need to work on reversing the recent undershoot.
Of course literary theorists know that stories can have many interpretations. What is Kafka’s Metamorphosis actually about?
If I were to tell a story about this a graph, the year 2006 would be of no importance at all. I would begin my story by focusing on productivity, not output per capita. Doesn’t real GDP per capita measure productivity? No, it does not.
So here’s my story. Between 1900 and 1973, America’s engineers and inventors made extraordinary strides that completely transformed a wide range of our industries. Here’s a 1903 airplane above a 1968 airplane:

I won’t bother showing you a 2021 airplane, as it looks similar to a 1968 airplane. Its interior electronics and engines are better, but the percentage gain is tiny compared to the gains during 1903-1968. Great strides were made in many other industries as well, including autos, home appliances, lighting, and infrastructure such as indoor plumbing. Life expectancy soared much higher.
After 1973, America’s engineers and inventors made extraordinary gains in one industry—computers. Productivity growth slowed sharply, with one exception. There was an upward blip in productivity growth during 1995-2004, which might have been real or might reflect a mismeasurement of the impact of PCs on the US economy. It’s a “matter of opinion”. In any case, that brief surge ended in 2004.
So if 1973 was the turning point when productivity growth slowed sharply, why does Klein’s graph make it look like 2006 was the turning point? What’s my “story”?
It turns out that various demographic changes disguised the productivity slowdown for several decades, at least when examined from the perspective of RGDP/person. After 1973, the share of the population that worked rose for several decades, as (non-working) children became a smaller share of our population and as more women entered the labor force. This growth in the labor force roughly offset the decline in output per worker, keeping RGDP/person growing at a relatively steady rate even as growth in RGDP per worker was slowing sharply.
By the mid-1990s, this demographic transition had mostly played out and RGDP/person growth would have slowed sharply if not for the nine year PC boomlet in productivity (or at least measured productivity.) In 2004, that boomlet ended and productivity growth went back to the slow rate of 1973-1995, where it has stayed ever since. Now there were no longer any special factors to disguise the productivity slowdown, and hence RGDP/person slowed sharply. And as boomers began retiring, the demographic dividend started to move in the other direction, a perfect storm of factors slowing RGDP/person.
In my story, there is nothing special about 2006. You had productivity growth slow after 1973 because our tech people were no longer able to radically transform almost all our industries, instead radically transforming only the computer industry. Of course it’s possible that at some point computers become so powerful that robots begin transforming almost all our industries, leading to a renewal of fast productivity growth. But we aren’t there yet. (It’s also possible that AI will destroy life on Earth.)
Every story has policy implications. If you believe something dramatic happened after 2006, you might focus on policies that could prevent a repeat of the Great Recession. I also want to focus on policies that prevent a repeat of the Great Recession, but not because I think the Great Recession had a significant impact on long run growth in RGDP/person. I see no evidence for that claim. The 1995-2004 boomlet in productivity ended even before the Great Recession of 2008. Rather, I want to prevent another Great Recession because big recessions are very bad.
READER COMMENTS
John Hall
Jul 2 2021 at 2:47pm
Or a story about two major long-term secular trends converging.
The question is: what happens going forward.
MarkLouis
Jul 2 2021 at 3:31pm
Excellent post – hadn’t thought of things quite that way.
I’m intrigued by the recent infatuation among many economists and commentators with “running hot” as though there is a free lunch involved. I’m sure there are many drivers behind this but two i’ve not seen discussed:
There is guilt about the disparity in outcomes across the population. A “run hot” strategy seems to give hope that labor will claim more of the pie but no one ever bothers to connect the dots to exactly how you get there without causing various other problems. Last i checked, monetary policy has no bearing on real wages.
With wealth:gdp at a record, the financial well-being of the average upper-middle-class person is as dependent on valuation more so than on real economic growth. Any argument that results in “more stimulus” becomes a good one when your wealth is reliant on permanent low-real rates (the mirror image of high asset valuations).
Scott Sumner
Jul 2 2021 at 4:59pm
You said:
“Last i checked, monetary policy has no bearing on real wages.”
That’s right, at least in the long run. In the short run, monetary stimulus reduces real wages. The “run hot” proposals are not very well thought out. “Deliver nominal growth stability” is a much more sensible objective.
Thomas Lee Hutcheson
Jul 2 2021 at 6:54pm
Right, but by the standards of 2008-20, for the Fed to achieve its inflation target with a smidgen of catchup, strikes many people as “running hot.”
Thomas Lee Hutcheson
Jul 2 2021 at 4:20pm
It’s hard to believe that the experience of seeing the Fed fail so spectacularly in achieving its inflation target during 2008-2020 would not dampen investments and hence real growth. It’s doing better since Aug 2021 but it may take time to re-establish confidence.
Jesse Carey
Jul 2 2021 at 5:19pm
What is an appropriate goal for NGDP level in this cycle? I would think it should be 4% growth from 2019, which we appear to be on track to exceed by the end of this year. Many that advocated for an NGDP target after the great recession seem to prefer something more aggressive though, without anything specific. It would be unwise to aim for pre-2008 trend NGDP level, right? That would require a lot of inflation without a clear benefit, as it would significantly exceed nominal income expectations made before COVID hit.
Alan Goldhammer
Jul 2 2021 at 6:10pm
Fuel efficiency has markedly improved since 1968 becuase of improved turbine engines, design, and materials. I think this is a significant advance. Similarly, autmobile manufacturing quality has risen dramatically along with fuel efficiency. One can keep a car for well over 10 years confident that with periodic maintenance it will continue to perform as when delivered. I don’t look at these as ‘tiny’ gains.
Scott Sumner
Jul 2 2021 at 7:40pm
You said:
“I think this is a significant advance. Similarly, autmobile manufacturing quality has risen dramatically along with fuel efficiency. One can keep a car for well over 10 years confident that with periodic maintenance it will continue to perform as when delivered. I don’t look at these as ‘tiny’ gains.”
That’s just wrong and it’s not even debatable. Even if the gain in overall quality is 100% (and it isn’t), it’s utterly trivial compared to the improvement between 1903 and 1968. Not sure why this is so hard to see.
john hare
Jul 2 2021 at 7:53pm
Actually the gain in over all quality is far more than 100%. Though your point on relative improvement is accurate.
The gains from 1903 to 1968 were phenomenal. But the gains since are quite useful. The construction equipment I use today is massively ahead of the best available in 1977 when I started. Though it is still not at all what it could be if the improvement trend had continued.
Scott Sumner
Jul 3 2021 at 12:20pm
I’d say much less than 100% better in an overall sense. Even if the engines are 200% more fuel efficient, the overall performance of the plane is not much better. It’s no faster, it holds the same number of seats, etc. It’s safer, but these planes were ridiculously safe from day one. Still uses two pilots and the same number of stewardesses. The same crappy food.
Christophe Biocca
Jul 3 2021 at 1:17pm
Your 1968 airplane example is the first iteration of the Boeing 747, the 747-100. It had a flight engineer in addition to the 2 pilots. The 747-400 (which entered service in 1989) eliminated the need for one. Other model changes either lengthened the “hump” or the entire fuselage, so room for passenger seats increased over time as well (and engine improvements gave increases in range and cargo capacity alongside fuel efficiency). Still marginal improvements, but there have been improvements on almost every margin over time.
John hare
Jul 3 2021 at 1:27pm
You quoted the portion on automobiles and responded. I assumed you were referring to cars.
Scott Sumner
Jul 3 2021 at 6:19pm
I see. Alan was responding to my claims about airplanes. In any case, progress in the auto industry has also slowed, but (as you say) less so than in the airplane industry.
Billy Kaubashine
Jul 4 2021 at 11:32am
Productivity gains in construction aren’t all that phenomenal. Consider the difference in time it took to build the Empire State Building (1930s — 410 days), the first World Trade Center (1960s — about 4 years), and the new World Trade Center (9 years or so).
Given the productivity enhancing advances in building technology and materials, (from workers’ walkie-talkies to battery powered saws and drills, etc), one would expect each successive project to take LESS time. Want to bet it was the increased regulations that account for the trend?
John hare
Jul 4 2021 at 7:30pm
Regulation is definitely a factor. Another is the aging of the construction workforce as younger people go elsewhere. The motivated have better opportunities than existed decades ago. The less motivated often not working at all, or taking dead end jobs that are “easy”. Also the increased complexity in many projects, often without good reason.
Billt
Jul 4 2021 at 10:08am
Interestingly a lot of the gains in automobiles are from computers. Anti-lock brakes, fuel injection among others. Fords have about 30 microcontrollers and BMWs have about 60.
Billy Kaubashine
Jul 5 2021 at 1:41pm
If only automobile price trends would track computer price trends.
Jonathan S
Jul 2 2021 at 7:18pm
So it would probably be better to look at productivity per worker. Here is a chart for Real GDP/worker from 1947-2016:
It doesn’t look nearly as disturbing as the GDP/capita story.
Jonathan S
Jul 2 2021 at 7:19pm
It doesn’t look like the link was added. Try this
Scott Sumner
Jul 2 2021 at 7:41pm
Note that a log scale would show a slowdown in the percentage growth rate.
Jonathan S
Jul 2 2021 at 7:55pm
True
marcus nunes
Jul 2 2021 at 11:06pm
According to Angus Maddison Output per hour worked from 1950 to 2018:
From 1950 to 1973: 2.8% per year
From 1974 to 2005: 2.1% per year
From 2010 to 2018: 0.6% per year
Seems that the GR (Fed made) had a significant “degrading” effect on the economy
Scott Sumner
Jul 3 2021 at 12:22pm
But what does 1974-95 show? And 2004 to 2020?
If you look at 2010-18 you are looking at less than one phase of the business cycle.
Brandon Berg
Jul 3 2021 at 8:58am
Is there any reason to expect exponential growth in productivity? I think of productivity growth on the frontier as the outcome of solving a series of highly heterogeneous scientific, technical, and logistic problems. A priorI, I would expect this process to proceed in fits and starts, rather than at a consistent rate. It’s also not clear to me why it should be exponential rather than linear in the long run.
Scott Sumner
Jul 3 2021 at 12:24pm
I don’t see any reason to predict any specific pattern.
Brandon Berg
Jul 3 2021 at 10:42am
I ran a linear regression on non-farm business real output per hour (2012=100), and got 16.8 + 1.18 * year, with an r-squared of 0.969. I charted this on top of the actual data here.
One story you can tell here is that productivity growth is exponential, with a falling rate. Another story you can tell is that productivity growth has been roughly linear for 74 years.
Obviously it can’t have followed this trend for very long before 1947; the regression predicts negative productivity in the 1920s, and we clearly see slower productivity growth prior to 1960.
The other story we can tell is the one I mentioned in my prior comment: Productivity growth might not naturally follow any particular pattern. On the one hand, as technology improves we have more tools. As population increases and more countries become wealthy enough to support research, we have more heads and hands working on solving technological problems. On the other hand, the technological problems just keep getting harder as the low-hanging fruit is plucked. Sometimes the balance favors faster growth, and sometimes it favors slower growth. Any resemblance to exponential or linear growth may be purely coincidental.
Brandon Berg
Jul 3 2021 at 11:16am
Disregard the part about the r-squared; I don’t know enough about statistics to know whether this is a good test for the linearity of time-series data, or how to interpret it; it seems that even a linear model of an exponential function can have an r-squared of well over 0.9 under certain conditions.
Brian
Jul 3 2021 at 3:42pm
Brandon,
A linear regression is a two-parameter fit, so the question is not whether R^2 = 0.969 is good, but whether another two-parameter fit does better. In the case of a two-parameter exponential fit, you get R^2 = 0.991, which is clearly better. The data clearly curve, so a linear fit will not do as well as a curvy fit. For example, a three-parameter quadratic fit gives 0.992, slightly better than the exponential, a cubic gives 0.9929, a quartic 0.9943, and a quintic 0.9972. This gives a sense of how much better the exponential fit is. It makes up most of the difference between 0.969 and 1.000 without adding any parameters.
Thomas Lee Hutcheson
Jul 3 2021 at 5:53am
But surely the spectacle of the Fed missing it’s inflation target so badly 2008-2020 and allowing a fall away from anything like full employment must have some disincentivizing effect on investment.
RCooper
Jul 3 2021 at 9:19pm
A guess is that we’re creating an incredible amount of free stuff (onine) and the distraction of creating this free stuff contributes significantly to the slowdown in measured productivity. (I’m not a fan of attempting to value the free stuff, in the same way valuations of unpaid housework or volunteer hours are generally uncompelling). But, the free stuff is quite valuable as it’s widely and heavily consumed and contributes to the utility of our leisure. While it wasn’t always impactful, the free stuff started in the 80s, though it exploded in the 00s.
I think that emotional and productive adolescence has extended as well. The age of marriage is much later than in 1973, and fewer people are having children. The delay and absence of both of those have got to contribute to a reduction in general productivity as peoples’ motivation reduces. Married people with children are much more highly productive on average than those who are/have not.
Asher
Jul 4 2021 at 10:00am
Only when I got to grad school did Rudi Dornbusch reveal this great secret to us: Many supposed economic trends are really just demographics. At that time everyone was swooning over Japan’s supposedly formidable savings rate (as well as their supposed incredible management abilities). Rudi pointed out that age-adjusted savings rates in Japan were similar to those in similarly developed countries. They just had an unusual age pyramid. (I had a relative working in a large firm in Japan who also debunked the idea that Japanese management was somehow superior to that in the US.) Scott’s is another great example, and there are many more.
Phil J
Jul 4 2021 at 10:10am
Here are two things from the last 50 years that I think future generations might look back on and be impressed by: (1) the invention of the solar panel. When the whole world is running on solar, 100 years from now, that’s going to feel more significant than it does right now. (2) The end of famine. In about the 1990s, global governance, communications, and logistics reached the point where protium has all deaths from hunger could be stopped. That’s an extraordinary turning point in human history.
Matthias
Jul 5 2021 at 4:24am
Productivity growth numbers in the rest of the world, especially China, look much better after the 1970s than on the US.
That’s mostly because Mao died, though.
Phil H
Jul 5 2021 at 10:04pm
Thanks for putting me on the front page (I’m Phil J, the J was just a typo). Sorry about the incomprehensible protium nonsense. I was typing too fast. Please always feel free to edit typos in my my posts.
Spencer Hall
Jul 4 2021 at 12:04pm
re: “Now there were no longer any special factors to disguise the productivity slowdown,”
Dr. Leland James Pritchard’s (Ph.D., Economics, University of Chicago 1933, M.S. Statistics, Syracuse) 1959 syllogism is apropos:
#1) “Savings require prompt utilization if the circuit flow of funds is to be maintained and deflationary effects avoided”…
#2) ”The growth of commercial bank-held time “savings” deposits shrinks aggregate demand and therefore produces adverse effects on gDp”…
#3) ”The stoppage in the flow of funds, which is an inexorable part of time-deposit banking, would tend to have a longer-term debilitating effect on demands, particularly the demands for capital goods” (CAPEX)
The percentage of time (savings-investment type deposits) to transaction type deposits rose to its highest level in history during this period, destroying savings velocity, destroying CAPEX.
The highly contractionary monetary policy that began in 2006 was never ending. But it resulted from different factors. Contrary to all economists (see Dr. Daniel Thornton), banks don’t loan out deposits. Deposits are the result of lending. An increase in bank CDs adds nothing whatsoever to GDP.
Spencer Hall
Jul 4 2021 at 12:17pm
re: “In my story, there is nothing special about 2006”
Yes there is: “In statistics and econometrics, a distributed lag model is a model for time series data in which a regression equation is used to predict current values of a dependent variable based on both the current values of an explanatory variable and the lagged (past period) values of this explanatory variable”
The money stock peaked on 12/1/2004 @ 691.6. It didn’t exceed that point until 11/1/2008 @ 701.8. Based on monetary flows, volume times transaction’s velocity, the proxy for inflation in American Yale Professor Irving Fisher’s truistic: “equation of exchange”, money flows started contracting at the exact same time as the Case Shiller Home Price Index. It didn’t reverse until March 2009.
Spencer Hall
Jul 4 2021 at 12:25pm
re: “I want to prevent another Great Recession because big recessions are very bad”
“Disintermediation is Made in Washington” (an inverted yield curve)
The commercial banks, and thus the Federal Reserve authorities using its IOeR policy rate, can force a contraction in the size of the NBFIs, and create liquidity problems in the process, by outbidding the NBFIs for the public’s savings. This process is called disintermediation, an economists’ word for going broke (disintermediation is an outflow of funds or negative cash flow). The reverse of this operation cannot exist. Transferring saved demand or time deposits through the NBFIs cannot reduce the size of payment’s System. Deposits are simply transferred from the saver to the NBFI to the borrower, etc.
See Lyn Alden Schwartzer’s graph, the IOR vs. 3mo Treasury Constant Maturity rate (the Sept. 2019 repo spike)
https://seekingalpha.com/article/4320078-curious-case-of-qe
Spencer Hall
Jul 4 2021 at 1:20pm
Because it’s real yields that matter to the economy, their decline since mid-March (Display) means that monetary policy has become even more accommodative, just as the economy is accelerating — AllianceBernstein
John Michael
Jul 4 2021 at 6:47pm
Since you didn’t include one, here’s a graph what you’re talking about (assuming I understood correctly): https://fred.stlouisfed.org/graph/?g=Fddp.
The red line is what 2.2% annual growth in RGDP per (non-farm) employee from 1947 on would have been. Blue is what we actually got. (It’s a log-plot, because FRED only lets you graph straight lines.) As you say, from this perspective, things changed in the late 60s.
Michael Sandifer
Jul 4 2021 at 10:37pm
The patterns of TFP and real GDP growth largely fit your story, except that mean TFP growth has been higher during the last few decades than in the 70s and 80s, though lower than the 50s and 60s. TFP growth is supposed to get at the effect of innovation on output growth, if I’m not mistaken.
1955-1959
Mean RGDP Growth: 1.7
Mean TFP Growth: 1.4%
1960-1969
Mean RGDP Growth: 3.1%
Mean TFP Growth: 1.0%
1955-1959
Mean RGDP Growth: 1.7
Mean TFP Growth: 1.4%
1970-1979
Mean RGDP Growth: 2.2%
Mean TFP Growth: 0.4%
1980-1989
Mean RGDP Growth: 2.2%
Mean TFP Growth: 0.5%
1990-1999
Mean RGDP Growth: 2.0%
Mean TFP Growth: 0.7%
2000-2009
Mean RGDP Growth: 0.9%
Mean TFP Growth: 0.7%
2010-2019
Mean RGDP Growth: 1.6%
Mean TFP Growth: 0.6%
Data is from Fred: https://fred.stlouisfed.org/graph/?g=Fbfk
I think there’s much truth to your story, but it is incomplete. You’re leaving out the role of negative real and nominal shocks in reducing not only real GDP and productivity growth, but specifically, the rate of innovation.
Note that in the link I offer above, TFP growth is cyclical. Forgive me if I’m oversimplifying, but I take this to mean that tight money, for example, in addition to reducing employment, population growth, workforce participation, and capital investment, also reduces TFP growth. The same is probably true of the loose monetary policy of the Great Inflation.
Of course, real shocks can also reduce productivity, including innovation, especially when coupled with nominal shocks inflicted by an inflation targeting central bank.
Here’s a history of west Texas crude oil prices, for example:
https://fred.stlouisfed.org/graph/?g=FbfT
Notice the spikes before/during the last 3 recessions prior to the pandemic. Also, notice how much higher oil prices rose during and after 2004. By 2006, oil prices more than doubled. Other commodity prices were rising as well. This had a non-trivial effect on real GDP, and due to the Fed’s reaction, NGDP. Even during that period of relatively high inflation and low RGDP growth, NGDP growth was below the 1995-1999 trend. From 2001-2005, it was only 5%, compared to 5.6% for the prior 5 year period. And in 2006, NGDP growth began to decline. Monetary policy was tight, by any rational reckoning.
Many now agree that monetary policy was tight during and for years after the Great Recession, but most economists seem to think wages should have fully adjusted by 2014 or 2015, at the latest. I think they are wrong. I think the nominal neutral rate was lower than many thought, and hence the economy was taking longer to return to equilibrium. I don’t think the economy ever fully recovered, though progress was made.
I can point to a lot of what I consider evidence for this perspective, but it would not be conventionally accepted evidence and hence would be a distraction here. Suffice it to say, that I think that a growing economy should not have negative real interest rates, or imbalances between the growth rates of stock prices, earnings, and the discount rate, in monetary equilibrium.
The main point here is that, as I’ve been saying for years, there are many indications that RGDP potential is greater than most think.
Michael Sandifer
Jul 5 2021 at 3:30pm
This is an interesting graph:
https://fred.stlouisfed.org/graph/?g=FdYB
It is the TFP at constant prices index over the labor force participation rate. By this measure, innovation/labor force participant has been growing, unlike during the Great Inflation.
Spencer Hall
Jul 5 2021 at 8:06pm
re: “Notice the spikes before/during the last 3 recessions prior to the pandemic”
Banks don’t loan out deposits. An increase in bank CDs adds nothing whatsoever to gDp. The stoppage in the flow of funds, and the tendency of interest rates to rise, forces the FED to follow an increasingly easier monetary policy. It wasn’t just oil that spiked. There was always a general increase in prices prior to recessions.
Link Dr. Philip George’s “The Riddle of Money Finally Solved”.
As the smartest man that ever lived said in 1963: “the growth of time deposits shrinks aggregate demand and therefore produces adverse effects on gdp”
Michael Sandifer
Jul 5 2021 at 9:18pm
Spencer Hall,
I buy Scott’s perspective that the Fed often overreacts to rising inflation and needlessly causes slower or even negative growth.
MarkLouis
Jul 6 2021 at 11:31am
It occurred to me that there is no such “gap” in US household net worth (or perhaps a very small gap).
What are the implications of net worth and GDP being so detached from each other? Do we lack a proper market signal pushing us to pursue high productivity policies?
Had GDP grown more quickly would we be any wealthier? My hunch is probably not since the discount rate would be higher.
Mike Davis
Jul 6 2021 at 1:36pm
So Scott’s story is that women entered the labor force in the ‘70’s, leading to an increase in per capita RGDP. That’s certainly true.But doesn’t that really just tell us that we were mis-measuring RGDP and the labor force? Home production doesn’t count in RGDP but it’s certainly valuable. Stay-at-home moms are definitely employed.
And so maybe to make Scott’s point in a different way, we should say that because of all the well-known measurement issues, per-capita RGDP is a crummy measure of productivity.
The weird thing would be if women moving into the labor force didn’t raise productivity. After all, Hillary Clinton can’t be the only women with a comparative advantage in something other than baking cookies and hosting teas.
Comments are closed.