Is the Chinese economy larger than the US economy? In nominal terms (measured at current exchange rates), the Chinese economy is only about two-thirds the size of the US economy. In purchasing power parity terms (adjusting for differences in prices), the Chinese economy is actually larger than the US economy. That’s because China has much lower prices.
Over the years, I’ve seen numerous commenters make the following two claims:
1. Economies should be compared using market exchange rates, as this shows a country’s ability to buy goods in global markets, or the purchasing power of its tourists when they travel overseas. Or it is more “objective”.
2. While Japan’s GDP has grown very slowly in recent decades, because of a falling population they haven’t done poorly in per capita terms.
But each claim is defensible, considered in isolation. On the other hand, these two claims cannot possibly both be true.
Here is a graph showing the nominal GDP per capita in the US and Japan since 1994, in local currencies:
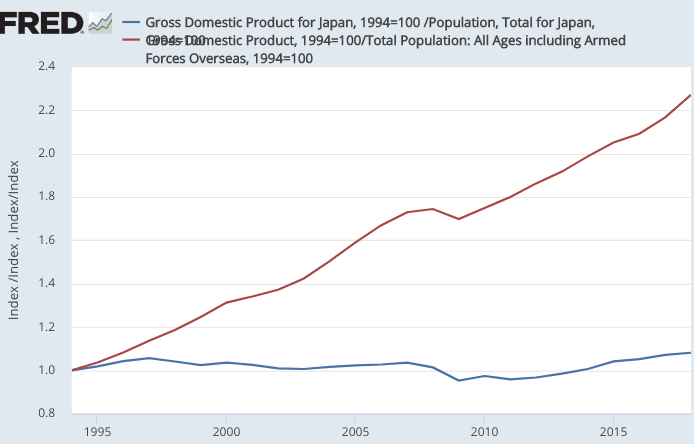 Japan’s nominal GDP (blue line) is up a total of only about 8% in 24 years. That’s nominal GDP. In contrast, the US is up more than 125%. Of course that doesn’t necessarily mean Japan is doing poorly, these are nominal GDPs and they’ve had some deflation. But now suppose you are one of those people who believes that the relative GDPs of countries should be compared using market exchange rates, as these are somehow more objective.
This graph shows the same NGDP per capita data, converted into the same currency (yen in this case, although you’d get the same disparity using dollars):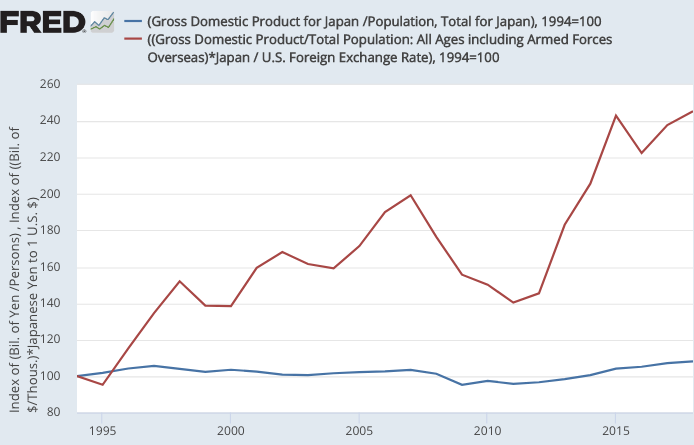 Now the gap is even larger, with the US up 145% in 24 years, while Japan’s GDP per person is up only about 8%. Relative to Americans, the Japanese are considerably less than half as rich as 24 years ago. If these figures are the correct way to compare countries, then Japan has experienced a Great Depression that makes America’s experience during the 1930s seem like just a bump in the road.
Let me hasten to add that I don’t believe these figures are meaningful. But you’d be forced to accept my analysis of Japan if you want to argue that market exchange rates are the best way to compare the size of the US and foreign economies.
I often see news media outlets claim that China has the world’s second largest economy. It’s a free country, and they are entitled to use market exchange rates if they wish. What the media should not do is argue that China is the world’s second largest economy, and then not report that Japan has recently experienced an economic collapse of epic proportions.
But of course that’s exactly what the media often does do. Just one more example of how much of what you read in terms of economic reporting is highly misleading.
Use PPP data, or don’t use PPP data. But make up your mind.
PS. Japanese tourists visiting Hawaii really have experienced a Great Depression. Because inflation has averaged about 2% in America, and because the $/yen exchange rate has been fairly flat, and because nominal incomes in Japan have been fairly flat, their yen buy a much inferior Hawaii vacation compared to what Japanese tourists were able to purchase in 1994.
PPS. You may wonder why my data seems so different from what you may have read about Japan’s real GDP per capita growing at a reasonable rate. The answer is simple; Japan’s real exchange rate has plummeted over the past quarter century. That’s why Japanese tourists now seem so much poorer than in 1994. People don’t notice the astounding change in the real exchange rate because the nominal $/yen exchange rate has not changed very much over 25 years. Money illusion.

READER COMMENTS
Market Fiscalist
Sep 23 2019 at 8:45pm
While I think I get the overall point you are making I am not sure I get:
‘Relative to Americans, the Japanese are considerably less than half as rich as 24 years ago. If these figures are the correct way to compare countries, then Japan has experienced a Great Depression that makes America’s experience during the 1930s seem like just a bump in the road.’
As these are nominal numbers they say nothing about wealth and also nothing about overall Japanese RGDP growth. Tf the Exchange Rate theory you are debunking is assumed to be true then the numbers would still be consistent with Japan having positive RGDP growth but just lower than the US – so I don’t get the Great Depression reference.
Scott Sumner
Sep 24 2019 at 12:13am
Market, Think of it this way. It’s often claimed that Americans have experienced relatively little growth in real income over the past 25 years. Now imagine that the real income of Americans was less that 50% of current levels. I’d say that would be viewed as a disaster.
Market Fiscalist
Sep 24 2019 at 9:49am
If the US had 2% inflation and 5% NGDP growth on average for that period and Japan had NGDP and RGDP both marginally above zero wouldn’t the charts looks like the ones in your post? The difference between the first and the second would be explained by the fact that the US is growing by 3% a year faster than Japan but with an inflation rate only 2% higher.
Market Fiscalist
Sep 24 2019 at 10:00am
Oops, forget that last reply. I see now that if showing relative NGDP in a single currency really does effectively filter out changes in the price level then the only ways to explain the difference between the 2 charts are that the US had deflation or Japan had negative RGDP growth.
Robert
Sep 23 2019 at 9:19pm
For reference, from Wikipedia: In economics, money illusion, or price illusion, is the tendency of people to think of currency in nominal, rather than real, terms. In other words, the face value (nominal value) of money is mistaken for its purchasing power (real value) at a previous point in time.
Benjamin Cole
Sep 24 2019 at 12:24am
Sheesh, there are many monkey wrenches in trying to compare international living standards.
For example, to rent a one-bedroom apartment in Sapporo Japan costs about one-third of that as in Los Angeles and one fourth of that in San Francisco.
I do not know how to measure the quality of healthcare, but it is a lot cheaper in Japan.
I do not know what city amenities are worth, but Sapporo is regarded as a pleasant place.
My back-of-the-envelope calculations indicate residents in Sapporo have a higher living standard than those on the West Coast of the United States.
MarkW
Sep 24 2019 at 9:51am
My back-of-the-envelope calculations indicate residents in Sapporo have a higher living standard than those on the West Coast of the United States.
That wouldn’t surprise me in the least. My own back-of-the-envelope calculations indicate that, due to insane housing policies and costs, residents of nearly every other place in the U.S. have a higher living standard than people living in L.A. and San Francisco. This is why California’s cost-of-living-adjust poverty rate is the nation’s highest and cost-of-living-adjusted median income is one of the lowest.
BW
Sep 25 2019 at 10:46pm
“This is why California’s cost-of-living-adjust poverty rate is the nation’s highest and cost-of-living-adjusted median income is one of the lowest.”
Do you have a source for that?
john hare
Sep 24 2019 at 4:45am
There was a radio commercial on a few weeks back that I mentally tuned out after just a few of their claims. The one that stuck was “The dollar is now equal to 19 Pesos, that means you can buy 19 times as much vacation for the dollar in Mexico.” As if the exchange rate defined the price of anything. Wanted to reach through the radio with a clue bat.
The Original CC
Sep 24 2019 at 7:37am
I don’t understand this: “While Japan’s GDP has grown very slowly in recent decades, because of a falling population they haven’t done poorly in per capita terms.” Wouldn’t you want to compare per capita GDP between countries anyway (which you do later in the post)? Why would anyone look at total GDP? What am I missing?
Of course we get a different story when we adjust for Japan’s falling population. But that’s not a PPP vs currency issue, right?
robc
Sep 24 2019 at 8:40am
I was going to make the same point. China’s economy isn’t #1 or #2, it is #108 (source: CIA World Factbook 2017 est) in per capita GDP-PPP.
If I were a US manufacturer looking to expand outside the US, and assuming I am manufacturing in the US and not in China, hence it is probably a high quality luxury product, I would expand to Liechtenstein and Luxembourg well before China.
China would be well down the list, about 107th (US at 19th was already covered).
Even if you want to say there is some density economy of scale in advertising, I still wouldn’t count China or the US as one market. I think Neilsen has the US about right at 210 market areas. I don’t know enough about China, but there would be a lot of them there too.
Scott Sumner
Sep 24 2019 at 2:29pm
You can compare GDP/person or you can compare total GDPs. Either comparison is perfectly defensible as long as you are clear about what you are doing.
milljas
Sep 24 2019 at 9:03am
I look at a country in the following ways:
Would I want to live there?
Would I want to start a business or invest in one there?
Who would win a war between the two countries?
I don’t really care which is the largest.
So Sweden or Switzerland?
For question 1 I look at GDP per capita in dollars as I’d assume that would buy more high quality goods. Probably Switzerland (plus better things to do) For question 2 I would look at both, but perhaps weight PPP more, so likely Sweden. For question 3 I look at GDP at market values as if these two countries were to engage in modern war, they would each have to buy military technology priced proportionate to the reserve currency. The two countries are about the same on PPP basis. Not sure.
Japan has been in a depression, but a growth depression.
I struggle connecting the idea that you believe so strongly in PPP yet I thought McCloskey’s paper (either you or Glasner cited this) basically proves there is no such thing as PPP.
Nevertheless an interesting post.
Lorenzo from Oz
Sep 24 2019 at 7:34pm
McCloskey actually has long thought purchasing power parity should be taken more seriously, not less.
https://www.deirdremccloskey.com/docs/pdf/Article_27.pdf
It is the price-specie-flow mechanism she is not a fan of.
Warren Platts
Sep 24 2019 at 1:24pm
I think PPP has fallen out of favor because the dominant MSM that promulgates that the status quo is hunky dory has a much harder sell if China is not the 2nd largest economy in the world. Even China’s state-run media propagate that story-line as part of the standard “hide ‘n’ bide” strategy. Their actions since 2014–when China surpassed the USA on a PPP basis (they are up about 20% now)–are that of a country that considers itself the world’s top dog.
Ignoring PPP also makes it look like China is not much of a military threat. However, since China’s military’s equipment is almost all home-produced, PPP is the way to look at it. Thus their military expenditures are twice that of the nominal level–that works out to about a $500 billion “defense” budget.
Scott Sumner
Sep 24 2019 at 2:33pm
Everyone, Both the US and China have enough nuclear weapons to kill most of the population of the other country. I’m not sure what we gain by thinking about GDP in terms of war fighting capability. Let’s hope we don’t go to war with China. Neither side would “win”
milljas
Sep 24 2019 at 3:44pm
Fair point, the simultaneous button push ends everything. Perhaps technological olympics, AI Race, not ARMS race, would have been better, and more fun!
My thought process was confused by issues of quality because while China’s economy may be larger an individual and by extension the country can buy less of equal items of similar quality. Relative to 1995 it does seem Japan has had some form of depression. But when I run similar charts since 1980 I get a different answer.
P Burgos
Sep 25 2019 at 9:17am
Shouldn’t GDP at market exchange rates tell you something about about how able a nation (or it’s people) are able to afford things whose price isn’t determined locally, but via some kind of international market?
Beyond that, I, like Benjamin Cole, am hugely skeptical that GDP per capita at PPP tells you much of anything, especially when comparing Urban living in two different places (first world-ish cities). Way too much of the differences in quality of life between any two cities aren’t captured in economic data, especially when what you really want from an Urban area is access to other people, career networks and opportunities, public amenities like parks and trails and walkable, tree lined neighborhoods, convenience in your daily activities, low crime, good schools, access to good healthcare, etc., and good public policy can deliver all of those things pretty cheaply, but you also have countries like the US, the UK (and maybe France and Italy) that have fairly high economic output, but even that high level of economic output (measures in exchange rates) doesn’t guarantee the large majority of people all of those rather basic things because public policy is too mucked up in one way or another in those countries. So shouldn’t there be a massive downward adjustment in the PPP GDP per capita for those countries? But I don’t see that in the data, which should make Canada look like a much wealthier country than the US simply because people in the US do pay exorbitant prices for homes in neighborhoods that are comparable in terms of crime and school quality to middling neighborhoods in Canada.
Parisian
Sep 25 2019 at 7:17pm
Dear Scott,
If the economy of Japan is doing well, then why has Japan’s real exchange rate collapsed?
I am currently visiting Japan for the first time, and I can see that life in Japan is great. The quality of airports and roads are even better than that of Paris. From the lack of any discernible poverty in the streets and the ability of Japanese people to afford more goods, it appears that Japan is significantly richer than France. However, Japanese and French GDP per capita are similar both in nominal and PPP terms. So can one say that PPP adjusted GDP per capita also does not say much about the relative well being of two countries?
keenan
Sep 25 2019 at 8:41pm
scott,
i am a bit confused here. 1 US = 0.14 China (current exchange rate). The USA did 19.3T USD GDP while China did 12.2T USD? GDP (2017 world bank estimate).
So, China did 12.2*(1/0.14)T Yuan GDP = 87.1T Yuan GDP = 12.2T USD GDP?
Or is the 12.2T Chinese GDP already in Yuan?
Comments are closed.