You see a lot of hand wringing about the plight of America’s middle class, so I thought I’d check the data. But which data? You might start with average incomes, but these are skewed by the rapid growth in income of the top 1%. So most experts believe that median income is a better metric. The next question is household income versus family income. I choose family for two reasons:
1. The data series for family income goes way back, whereas household income starts being collected in the mid-1980s.
2. Households include single individuals, whereas families are multi-person households. I was technically “poor” from age 18 to 26, but I don’t think anyone was too concerned about my plight. Nor should they have been. I was a household, but not a family. I think when people talk about the plight of the middle class they tend to envision families.
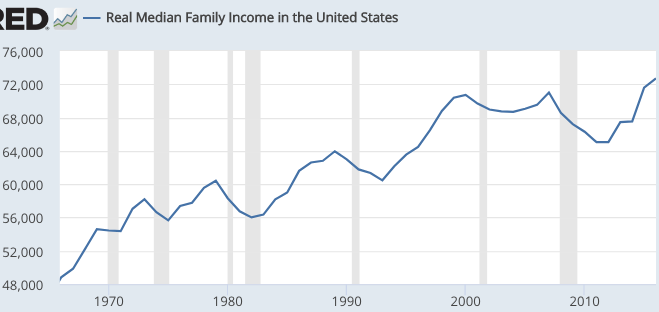
The next question is whether to use real or nominal income? I think most people believe real income is a better measure of living standards. So here’s real median family income from 1966 to 2016:
Real median household family income has soared from $48,800 in 1966 to about $72,700 in 2016, an all-time high. And keep in mind that 1966 was a golden year for the US economy, a period where living standards had reached highs that were far above almost any other time or place in human history. And from that point we’ve gone still higher, much higher.
And it gets even better. Most economists think that the CPI (used to construct this data series) seriously overstates inflation. They tend to prefer the PCE price index. Using that index to deflate median family income, I came up with this graph:
Now the real median family income has nearly doubled, soaring from $48,800 to $92,900. Live must be pretty sweet for the median American family.
Let me anticipate some objections:
1. There are more two-income families today. But does anyone really think people are working harder than in 1966? Lots of grueling, boring factory jobs have been replaced by office work where people spend 1/2 the day surfing the web (which is consumption disguised as work.) Women do far less housework than before. Those affluent women with grueling jobs sometimes have maids to help out around the house. It doesn’t seem to me that people work harder than in the 1960s. In addition, families tend to be much smaller, so that $92,900 is shared among a smaller number of family members.
2. We are richer than ever, but the growth rate has recently slowed. Yes, but that’s a pretty weak argument. There’s no iron law of economic growth that says the world will continually experience the sorts of growth rates in family incomes than we saw in 1945-73. That was a very unusual period of time.
My point is that all the hand wringing about middle class families is off base. They are doing spectacularly well. Maybe their already extremely high living standards are improving at a slower rate than before, but that hardly counts as a crisis, (or “carnage” to use Trump’s language.) And I’d add that the past 4 years have seen rapid growth in real median incomes.
I’m sure I missed something here, so I look forward to your comments below.
PS. If your eyes are telling you that living standards are declining, then I suggest you read this post, and get new glasses. There’s a reason why new homes being built today are far nicer that the sort of “Levittown” homes built after WWII to house the middle class:
PPS. In a recent MoneyIllusion post, I pointed out that birth rates in America continued to plunge in 2016, despite soaring median income in recent years. A commenter Alec Fahrin pointed out that the early data from 2017 point to a continued decline in birth rates. The widely held view that the Great Recession is responsible for lower birth rates seems to have surprisingly little empirical support. Whatever is causing the plunging birth rate in places like Germany and America; it’s not “hard times”. If you want high birth rates, go to central Africa.
READER COMMENTS
Matthew Moore
Sep 24 2017 at 2:03pm
3. We care about utility, not income, and utility for the middle class is lower because of (pick from): insecurity of income, uncertainty about children’s income, decline of the family, decline of civil society, decline of faith, racial resentment, cultural anxiety, culture wars on middle class bourgeois values, increasing pace of social change, increasing pace of technological change.
(None of these things personally lower my utility, except possibility some of the culture wars stuff, where I can’t easily give my true opinion on religion, regulation, tax, etc, at work or in casual social settings. I still think it’s easily the best time in history to step through the Rawlsian veil)
Max
Sep 24 2017 at 2:10pm
One question, does the CPI or PCE include all increases of the cost of living like aggregation in cities with high rental costs? Last time I saw inflation baskets they had many high tech articles (they got cheaper) and fewer living essentials which got slightly more expensive.
I only know this for my country Germany and here rental prices nowadays take up a third of income after taxes and houses are near unaffordable. Also a local kebab increased from 3 euro to 4,50 within 10 years.
Tim Worstall
Sep 24 2017 at 2:53pm
“Women do far less housework than before.”
Leisure hours have increased for both men and women:
http://econweb.ucsd.edu/~vramey/research/How_Much_Has_Leisure_Really_Increased.pdf
Not only are we getting richer we must be getting richer if that is true.
David Boaz
Sep 24 2017 at 2:54pm
Why is it that using PCE seems to reduce the effect of recessions and smooth out the curve?
Mike W
Sep 24 2017 at 6:40pm
Real median household income has soared from…
Should be family income.
Matthew Waters
Sep 24 2017 at 7:49pm
Well, even the PCE graph has a 15 year stagnation in real income from 1999 onwards. So that’s not really great.
OTOH, there are two offsetting issues that help your argument.
1. The compositional effect of most immigration being below median family income.
2. The effect of total compensation. Every income series should make clear, in bright lights, whether its income or total compensation. This appears to be income.
IMO, there are real hedonic reasons for the feelings of stagnation. I agree that the stuff longing for the 50’s and 60’s is wrong. But there are also real hedonic issues with post-2000 compared with 50’s through 80’s:
1. More employment insecurity, excepting government jobs.
2. The allocation of cost increases to housing, higher education and health care. Decreases in costs in other areas is very real, but something like electronics or appliances is less essential than health care.
3. The issues with quality adjustments in health care. PCE can say a new drug costing 100x more is really worth 100x a previous drug which is still being a sold. Well, who can really that drug isn’t 100x more valuable? Even if it leads to 10 years more of life, it’s not hedonically the same as a house that’s worth 100x more your current house.
Finally, the “real” longing for the 50’s and 60’s is how males without college degrees have done. Even a PCE-deflated income shows stagnation for males without college degrees (though that has obvious compositional effects with immigration).
Scott Sumner
Sep 24 2017 at 8:47pm
Matthew, I have no idea whether I am happier than 50 years ago. I can’t even imagine pontificating on the happiness levels of 100s of millions of people I’ve never met. But if you say most people are less happy, I don’t have any evidence to refute your claim.
Max, Yes, those indices include housing costs.
Tim, Good point.
David, I’m not sure.
Mike, Thanks, I fixed it.
Matthew Waters, I’m not sure there is less employment security. Aren’t people switching jobs less often? Recent data on weekly unemployment claims (as share of the workforce) is far lower than any other period in US history.
I agree with some of your other points, like the compositional effects.
Mark
Sep 24 2017 at 10:53pm
Another difficult to quantify measure of standard of living is that not only does the average American have significantly more leisure time, but leisure time is more valuable as there is a great deal more that can be done with it.
And as leisure time gets more valuable, people increasingly work less in response to wage increases to get more leisure instead of more income, which leads to the appearance that income is stagnating, when perhaps really it’s that the demand for leisure time is increasing.
Matthew Waters
Sep 25 2017 at 12:17am
I didn’t elaborate on the point because I wasn’t sure myself. Certainly, most people think employment was more stable in the 50’s and 60’s.
In 1999, there was a Journal of Labor Economics dedicated to looking at labor turnover, especially in 1980’s and 1990’s. There was a real increase in involuntary terminations from 1970’s to 1990’s, especially among males who had longer job tenures.
https://www.jstor.org/stable/10.1086/jole.1999.17.issue-s4
That makes sense to me. At least anecdotally, jobs in healthcare, education and government have very low involuntary job loss and the US increased those number of jobs. Men were more likely to work in non-healthcare companies and, especially those with longer tenure, saw more involuntary job loss.
The initial claims data set only goes back to 1967. I put a graph of the unemployment rate and (initial claims)/(civilian labor force), with unemployment rate going back to late-40’s.
https://fred.stlouisfed.org/graph/?g=fbC9
There are many ways to look at this data. Let’s say the initial claim percentage is the percent of the labor force suffering involuntary job loss any given week. It’s curious that the initial claim percentage in the late 60’s equalled the initial claims in 2002 or 2010. But unemployment in the late-60’s was consistently at 4%.
Without more analysis, I think the unemployment rate matches up very well with the general anecdotes. The 50’s and 60’s had multi-year periods of 3-4% unemployment which simply didn’t exist later, whether for supply or demand reasons.
And the same point about males without college degrees pertains. Both job stability and income is heavily influenced by females in the workforce, more stable service-sector jobs, etc. For job stability to be merely neutral with so many more stable service-sector jobs, males without college degrees probably have done much worse.
The Original CC
Sep 25 2017 at 8:06am
Good point. But there’s one other issue: In the 60s, one spouse may have stayed home and done housework. If that spouse goes out, works, and hires a maid, then this counts as higher income on two fronts: The new salary counts towards national income as does the maid’s pay. This should arguably only count once.
So having both mother & father working can inflate the income numbers a bit. One “extra job” is being performed but we “get credit” for two. (And yes, I do understand that both men and women have more leisure time than they used to.)
Ironman
Sep 25 2017 at 10:19am
If you want to drill down further, median income data is available for individuals, which can be combined to produce equivalent families and households whose incomes fall within a relatively small margin of error of the actual reported median incomes. For more information, and links to the data sources, see here.
BH
Sep 25 2017 at 11:44am
[Comment removed for supplying false email address. Email the webmaster@econlib.org to request restoring your comment privileges. A valid email address is required to post comments on EconLog and EconTalk.–Econlib Ed.]
Gary D Anderson
Sep 25 2017 at 12:11pm
There is a huge amount of wasted income when two people are working. Transportation costs explode. So do child care and food costs eating in restaurants. I know of a house that recently sold for 3 million dollars in SoCal that was purchased in the 60’s for 30 thousand dollars. So, for much of LA at least, I don’t think the middle is doing that great considering the costs. Add to this housing being pushed up in value by speculation and it is not as rosy for two income families as the charts indicate.
Chris Wegener
Sep 25 2017 at 12:37pm
Interesting article.
One point that I think is overlooked is that people tend to feel rich or poor by comparing themselves to other people not by their absolute measure of wealth. I like to say “You are never as poor as when you drive through Beverly Hills.”
In the years after World War II there was a much narrower band of incomes that people lived in and because of their experiences from the great depression people where much more careful with debt (nor was there as much emphasis’s on trying to get people to borrow money.) Thus people, with the exception of minorities, felt wealthier.
Now, though as the article explains, people are in absolute terms wealthier, their acceptance of easy credit and more exposure to wealth they find themselves working longer hours and have less disposable income. The net effect is that they feel poorer and are encouraged to spend more money in a fruitless task to live as well as the images they are exposed to.
It doesn’t help to say to someone that they live better than a tiny fraction of the world’s population has ever lived when they are constantly exposed to people who are far wealthier than they are.
Phil
Sep 25 2017 at 12:40pm
Not only is income rising, the cost of many things we buy is falling, especially in terms in the number of hours of work required to acquire the thing.
And the reliability of many things are increasing. You were lucky if you got 75,000 miles out of that 1966 Ford; and you would have replaced half the components under the hood by then, and topped off the oil with each fill up. Your 2016 model is good for 250,000 miles or more with nary a repair. And it is a lot safer, too.
David R Henderson
Sep 25 2017 at 12:54pm
@Chris Wegener,
It doesn’t help to say to someone that they live better than a tiny fraction of the world’s population has ever lived when they are constantly exposed to people who are far wealthier than they are.
I think you mean “a large fraction.” If so, I have found that it has always helped me a great deal. Your mileage may vary.
Chris Wegener
Sep 25 2017 at 12:55pm
As a further thought
Chris Wegener
Sep 25 2017 at 2:21pm
@David Henderson
I have bitterly learned that my rational logical outlook on life carries very little weight with most people. Trying to understand most human behavior I have learned that the older more emotional part of the brain tends to control most peoples thinking and actions and if I want to understand them I must see their choices through that prism.
Thus your large fraction is in my experience virtually everyone.
Justin Dailey
Sep 25 2017 at 3:20pm
–“Why is it that using PCE seems to reduce the effect of recessions and smooth out the curve?”–
Probably an optical effect of different scales. The first chart Y-axis ranges from 48,000 to 76,000, and the second from 40,000 to 100,000.
John Mittton
Sep 25 2017 at 4:03pm
Interesting Chart. If you draw a line touching just the peaks up to 1999, and do so after 1999, the slope has changed considerably for the worse.
It appears from studies that scale folks income into 5 classes (lower, lower middle, middle, upper middle, upper) the middle class has declined from around 50% of the nation to perhaps 30%, if I recall correctly. About 10% moved up, and 10% moved down. The issue is less the median income than it is the disparity of incomes, and the increasing divide between haves and have-nots. Looking only at median income effectively obscures the problem.
I’m open to the idea that people have it better than they think (and on some points agree that they do), but it requires a more authentic effort to convince me people aren’t struggling in greater numbers, and aren’t more insecure about their jobs (I know I am). I encourage you to dig a little deeper.
Floccina
Sep 25 2017 at 4:08pm
And your chance of being murdered has been cut in half. The air that you breath is most likely cleaner as are most bodies of water in the USA. No more lead in the gasoline.
LK Beland
Sep 25 2017 at 7:29pm
You mention that “[t]here are more two-income families today.”.
An approximate way to account for this is to divide the real (pce-based) median family income by an index of the employment-population ratio.
Here it is: https://fred.stlouisfed.org/graph/fredgraph.png?g=fcl8
Rapid growth of income from 1955 to 1972,
Stagnation of income from 1972 to 1992,
Rapid growth from 1992 to 1999,
Slow growth from 1999 to 2012,
Rapid growth from 2012 to 2016.
Right Wing House Music
Sep 25 2017 at 7:58pm
Professor Sumner,
Have you considered that family income is rising because women entered the workforce?
Have you considered the idea that we no longer live in a society where a single breadwinner can provide for an entire famiy, while a stay-at-home parent raises children full time?
Greg Jaxon
Sep 25 2017 at 9:05pm
Whether using CPI or PCE, your family income number is entirely concerned with current consumption. Another way of evaluating the well-being of a family is to say what its wage-fund is worth; so in 1966 a fund of $1,010,973 invested in 5y UST-bonds @ 4.83% would throw off their $48,800 income. By 1980, their wage could be covered by just $541,666 invested at that era’s 5y Treasury rate of 12%. Nowadays a family lucky enough to pull in a $92,900 income would be holding risk-free assets worth $5,076,502, since 1.83% on a 5y Treasury yields a historical low. I sampled this historical series of bond rates.
I think this reveals why both viewpoints (Scott’s and Matthew Waters’s) coexist. Getting that 1980 job was, in a sense 9.4x easier than getting the 2017 job. That is to say, a 1980 economy of the same same size as 2017’s (measured as risk-free capital investment) produced 9.4x as many median family income streams.
Scott Sumner
Sep 26 2017 at 1:43am
Right wing, You asked:
“Have you considered the idea that we no longer live in a society where a single breadwinner can provide for an entire famiiy, while a stay-at-home parent raises children full time?”
Yes, I considered that theory, and then realized it does not match the data. Average wages in America are high enough to support a family at Italian living standards. Also high enough to support a family at America’s living standards of the 1960s.
Matthew Moore
Sep 26 2017 at 7:50am
@Scott – I don’t actually believe my proposed point (3), I’m just saying its the most powerful counter argument.
Yaakov Schatz
Sep 26 2017 at 5:24pm
If you want high birth rates you do not need to go to central Africa. You can come to Israel.
Comments are closed.