In the history of American central banking, Arthur Burns (1970-78) and G. William Miller (1978-79) are often viewed as villains, largely responsible for the Great Inflation. (Although Martin (1951-70) was the one who got the ball rolling.)
A new paper by Thomas A. Lubik, Christian Matthes and Tim Sablik of the Richmond Fed suggest that Burns has gotten a bad rap, and that the anti-inflation policies of Paul Volcker actually began under Burns:
Economists often describe the Great Inflation of the 1970s as a failure of the monetary policy actions of the Federal Reserve under Chairman Arthur Burns. According to conventional wisdom, when Paul Volcker became chairman of the Fed in 1979, he implemented changes that ushered in a period of disinflation. This Economic Brief challenges this standard narrative in two ways. First, it argues that the “Volcker disinflation” had its roots in 1974. And second, Volcker’s actions were the culmination of a gradual shift in policy that began under Burns rather than an abrupt shift.
I’m not buying this argument. Burns ran highly expansionary monetary policies during the 1970s, despite high and often rising inflation. The results were disastrous. There’s simply no way to excuse the policy errors of the Fed.
Let’s start with the stance of monetary policy. Back in 1999, Ben Bernanke pointed out that neither interest rates nor the money supply were good indicators of the stance of monetary policy. Instead, you needed to look at NGDP growth and inflation. I agree. But both NGDP growth and inflation were rising under the Burns regime, and both were far above reasonable levels. This called for tighter monetary policy, but the Fed refused to bite the bullet.
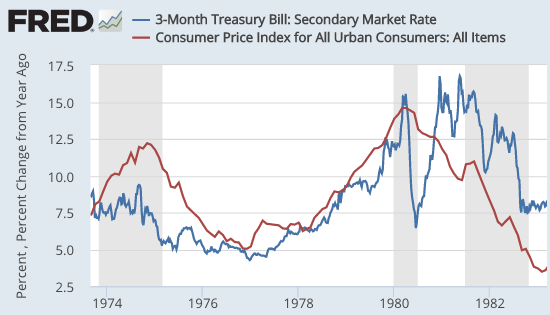
I do realize that not everyone accepts the view that interest rates and/or the money supply do not represent the stance of monetary policy. So let’s look at those variables, starting with interest rates. The following graph shows the 3-month T-bill and the 12-month inflation rate during the period after 1974, when Burns was supposedly adopting an anti-inflation policy:
Several things stand out in that graph. First, inflation is quite high during the entire period. Indeed the lowest inflation rate (roughly 5%) is still far too high. Thus the Fed should have been aggressively tightening policy throughout the entire period, to bring inflation down. In fact, they were often doing just the opposite. The Fed held interest rates below inflation throughout the entire period up to 1981, when Paul Volcker got serious about addressing inflation. In the period up to 1977, the Fed was actually reducing interest rates—what were they thinking?!?!? Even after 1977, real rates were pushed into negative territory, despite high and rising inflation rates. Again, this was utter madness.
Monetarists prefer to look at the money supply, not interest rates. But that tells the same sad story:
Growth in the monetary base rose from near-zero in 1960, to about 8% during the worst of the Great Inflation. NGDP growth was even higher than 8% during this period, as rising inflation rates also tend to boost velocity. The public fled from a dollar that was rapidly losing value.
People like Robert Mundell might prefer looking at the forex value of the dollar, rather than either interest rates or inflation, but that told the same story—the dollar depreciated sharply in forex markets during Burn’s tenure. Gold bugs prefer the price of gold, which soared dramatically higher during the Burns years. We did not have TIPS market yet, but long term nominal bond yields were rising to very high levels, suggesting that Burn’s anti-inflation policy had absolutely zero credibility. This is especially damning.
The authors suggest that Burns was hurt by the fact that real time macro data often indicated more weakness than the revised figures, whereas Volcker actually benefited from the fact that inflation was slowing faster than the real time data suggested (due to later revisions.) That might explain a small part of the Burns fiasco, but can’t really be used as an excuse. I lived through that period, and I can tell you that nobody expected inflation to return to 2% in one, two, three or even four years. The public was extremely pessimistic, and justifiably so. Even without TIPS spreads, the Fed had to know that inflation would run well above 2% under their policy regime.
I’m not against taking a fresh look at the past, and coming up with contrarian views. Elsewhere I’ve argued that Volcker’s monetary policy during 1979-81 was actually highly expansionary, and it only become contractionary in the second half of 1981. But in this case I’m not buying. By any metric, Burns ran a highly expansionary monetary policy throughout his tenure (partly to help Nixon get re-elected), and the public expected that policy to produce high rates of inflation, and that policy did in fact produce high rates of inflation.
Sometimes when he walks like a dove and quacks like a dove, a Fed chair is a dove.
[Do doves quack?]
PS. Some people wrongly blame the 1970s inflation on supply-shocks. If that were true, then you’d expect NGDP growth to have been on target (at around 5%), with higher than usual inflation and lower real growth. In fact, NGDP growth from 1971-81 ran at about 11%. Since real growth was perfectly normal (at around 3%) we ended up with 8% inflation. That’s exactly what you’d expect if the 1970s inflation were 100% demand driven.
HT: Karl Rhodes, Lorenzo from Oz
READER COMMENTS
Joe B
Dec 6 2016 at 10:32am
I think doves “coo”. I am grossly unqualified to assess any other part of this post (or most of the others I read here and elsewhere).
Andrew_FL
Dec 6 2016 at 11:37am
For the record, doves coo.
bill
Dec 6 2016 at 12:25pm
One market price Burns could have looked at was the rate on 10 year Treasuries. I wonder if our current Fed looks at our 10 year T’s? (slight sarcasm)
BC
Dec 6 2016 at 12:36pm
On the supply shocks issue, how does one explain the periods where there was both high inflation and high unemployment, which gave rise to the misery index and stagflation? Were these periods just movement along the AD curve as the economy transitioned from the SRAS curve to the vertical LRAS curve? I thought unemployment was actually high in absolute terms, not just rising from a low level. Was the full employment unemployment rate also changing throughout the period?
Scott Sumner
Dec 6 2016 at 1:23pm
BC, There were some adverse supply shocks, notably in 1974 and 1980, but those were offset by periods of strong growth in AS. Overall, it was roughly a wash, as RGDP grew about 3%/year during the 1970s. The inflation was caused by AD growing at 11%/year.
Plucky
Dec 6 2016 at 2:48pm
I’m of the opinion that what makes Burns a villain of monetary policy is the level of coziness he had with the contemporary administrations. His monetary policy was terrible, but as you point out, it’s not obvious Martin would have done things all that differently and got the ball rolling on inflation.
The problem with Burns was that he was not just chairing the Fed but also continuing his pre-Fed chair role as economic advisor to the administration, and may or may not have had partisan reasons for conducting monetary policy ’71-72. Even if his motives 71-72 were genuine, by being so close to an administration undermines the nonpartisan nature of the Fed. Bad, even disastrous policy decisions are in some sense inevitable from institutions, but they can at least be rectified if everything is being done on the up-and-up. For a Fed chair to allow even the appearance of partisan behavior threatens the basic functioning of monetary policy. To do it as the successor to Martin, who for all his faults worked very hard to get the Fed out from under the thumb of the Treasury, is pretty inexcusable.
Brian Donohue
Dec 6 2016 at 6:13pm
Scott,
Between 1973 and 1982, the real “national average wage” (from Social Security) fell 12%.
This is way more dramatic than anything seen in the more recent ‘stagnation’, but I never hear anyone pointing to this extraordinary experience.
Nobody in 1982 was talking about falling wages. Money illusion?
Anyways, unemployment was pretty high for most of the 1970s. Would it have been worse under a tighter monetary regime?
Scott Sumner
Dec 6 2016 at 6:14pm
Plucky, Yes, I agree. I would add that the profession as a whole deserves some of the blame for the Great Inflation, as most leading economists were not critical of what the Fed was doing.
Scott Sumner
Dec 6 2016 at 6:18pm
Brian, No, I don’t think unemployment would have been higher under a tighter monetary regime, at least in an overall sense. It would have been higher in some years and lower in others.
Capt. J Parker
Dec 6 2016 at 8:46pm
Ok, so, inflation is a monetary phenomenon and Burns should take the blame. This I believe. Yay Milton Friedman.
But if you look at ’72 through ’76 you would conclude Burns was doing a pretty good job of creating a nice stable growth path for NGDP (exactly like a market monetarist would want) yet real GDP began falling in mid ’73 and by ’74 we were in recession. So, a casual observer would say NGDP path targeting doesn’t work that time. I raised this issue once before and Dr. Sumner was kind enough to reply that wage and price controls were the problem. But, those controls were gone by early ’74 and in any event what would have been the clue in ’73 -’74 that the nice stable path of NGDP wasn’t doing it’s job? It can’t be the jump in inflation because MMs have been arguing for higher inflation targets if that’s what it takes to keep NGDP on the desired path. And it can’t be the ‘stance’ of monetary policy as measured by interest rates. If MMs try to claim you can judge the stance of monetary policy based on interest rates they will get both barrels from Bob Murphy.
Scott Sumner
Dec 7 2016 at 9:18am
Captain, I have a new post, which responds.
Lorenzo from Oz
Dec 8 2016 at 2:38pm
So much for Arthur Burns then …
Comments are closed.